




















Presenting a thesis in systems engineering is not simply about showing code or explaining theory. It's about demonstrating architecture, analysis, planning, testing, and results in a clear and structured way. And in a technical environment, visual organization can make the difference between a solid presentation and a confusing one.
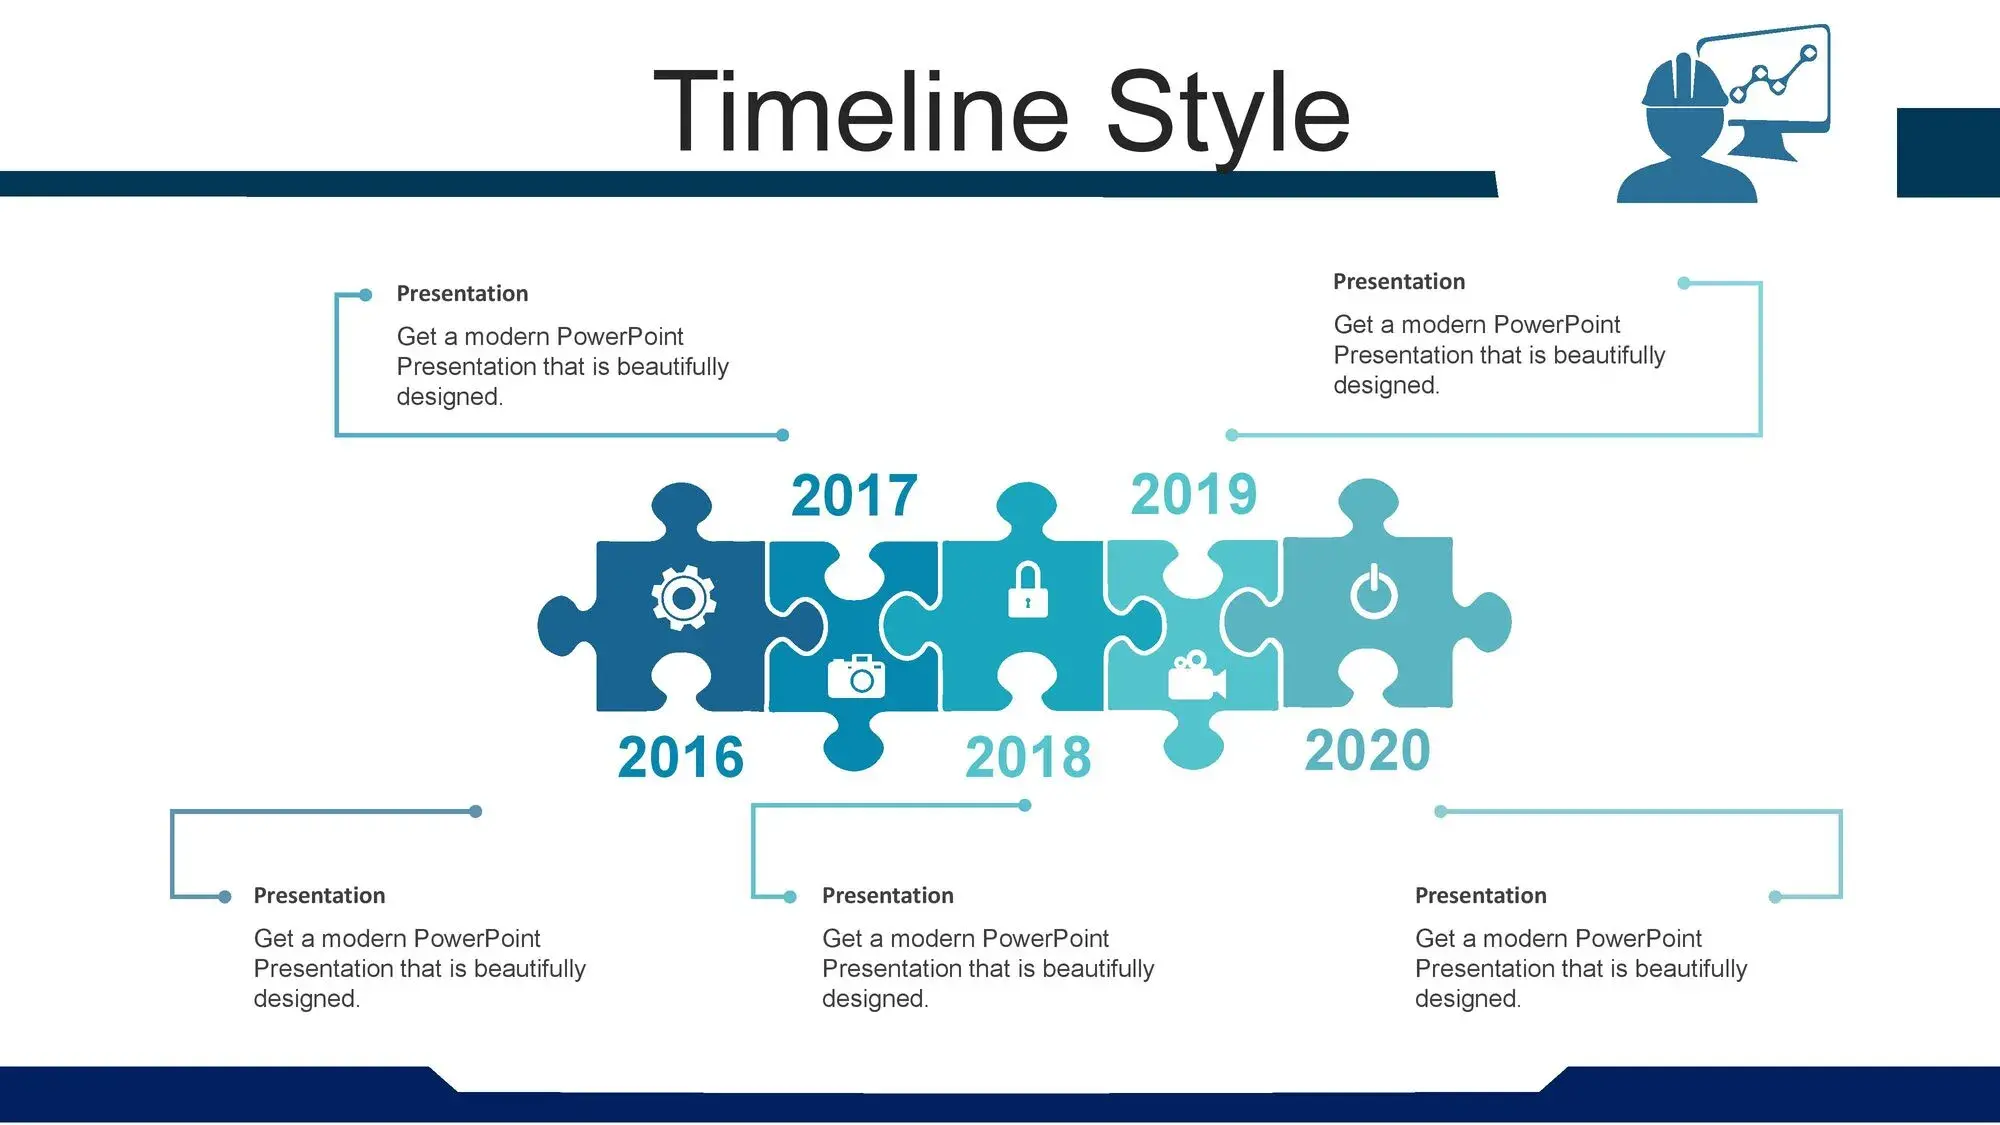
When I prepared a technical presentation, I realized something key: The great thing about this PowerPoint is its 38 fully editable slides, where you can enter information and present it in charts and timelines. That completely changes the way you organize a complex project.
Why do you need a PowerPoint template for a systems engineering thesis?
A thesis in systems typically includes:
- Statement of the technological problem
- Requirements analysis
- System architecture
- UML Diagrams
- Development methodology
- Project timeline
- Results and validations
- Technical conclusions
Trying to structure all of this from scratch can waste valuable time. A PPT template for a systems engineering thesis allows you to focus on the content while maintaining a professional presentation.
In my experience, I noticed that the good thing about this ppt is its 38 100% editable slides, which makes it easy to organize modules, processes, and phases without altering the base design.
How to properly structure your thesis presentation in systems
1️⃣ Introduction of the technological problem
Explain the context, the need, and the impact of the system developed.
2️⃣ Theoretical framework and technical foundations
Languages, frameworks, methodologies (Scrum, waterfall, etc.).
3️⃣ System analysis and design
Flowcharts, use cases, architecture.
This is where it makes sense that you can enter information and present it in your graphs and timelines, because visualizing technical processes greatly helps the jury.
4️⃣ Development and implementation
Technologies used, code structure, environment.
5️⃣ Tests and results
Performance metrics, validations, comparisons.
6️⃣ Conclusions and future improvements
The value of graphs and timelines in engineering
In systems engineering, data matters. But if it's not presented correctly, it loses its impact.
That's why it's essential to have visual resources that allow you to:
- Representing development timelines
- Display software life cycles
- Explain integration processes
- Visualize data flows
When I worked with this structure I understood that the good thing about this ppt is its 38 100% editable slides, where you can enter information and present it in its graphics and timelines, which makes it easier to explain even complex architectures without overwhelming the jury.
Advantages of using an editable template for a technology thesis
✔ Time saving
You don't have to design from scratch.
✔ Visual coherence
The entire project maintains a professional graphic style.
✔ Full customization
You can customize colors, graphics, and vectors.
✔ Compatibility
It works in PowerPoint and Google Slides.
In technical projects, clarity is key. Being able to input information directly into structured charts prevents last-minute improvisations.
How to stand out before the jury in your defense
The technical jury evaluates:
- Ability to synthesize
- Conceptual domain
- Clarity in architecture
- System viability
A clean and structured presentation conveys professionalism. And when you know you have 38 strategically organized slides, you reduce stress and boost your confidence.
In my case, being able to use pre-designed graphics allowed me to focus more on explaining the logic of the system than on worrying about the visual design.
Professional template vs. impromptu presentation
Create slides without structure:
❌ Visual clutter
❌ Too much text
❌ Lack of coherence
Use a specialized template:
✔ Professional design
✔ Better organization
✔ Greater impact
✔ Smoother defense
In systems engineering, the way you communicate your project is part of your evaluation.